Open-sourcing evals for open-weight agents
The Hill Climber's Checklist for evaluating open-weight agents, with scores, tradeoffs, and public traces.

Published August 18, 2026 · Originally published on the Cline Blog.
Preface
With new model releases like Fable and Gpt-5.6 Sol, it’s becoming increasingly clear that closed-weight models are becoming a very expensive commodity, leaving us at the mercy of frontier labs to tell us what to use and how much.
We've reset your limit pic.twitter.com/ca7qK34kxu
— @levelsio (@levelsio) July 10, 2026
Most coding-agent subscription plans lack pricing transparency, and the credit limits could have different token values depending on the day. Even the most pro-AI-usage, token-maxxing companies are now finding that their options are either to default to open-weight models or simply to make their own harness for efficiency.
At Cline, we noticed an unusual rise in the token usage of open-weight models in the last few months for obvious reasons, such as price and quality improvements that make open-weight models on par with or better than closed-weight models.
After stack-ranking our usage, we saw that the five most-used models in Cline right now are all open-weight models.
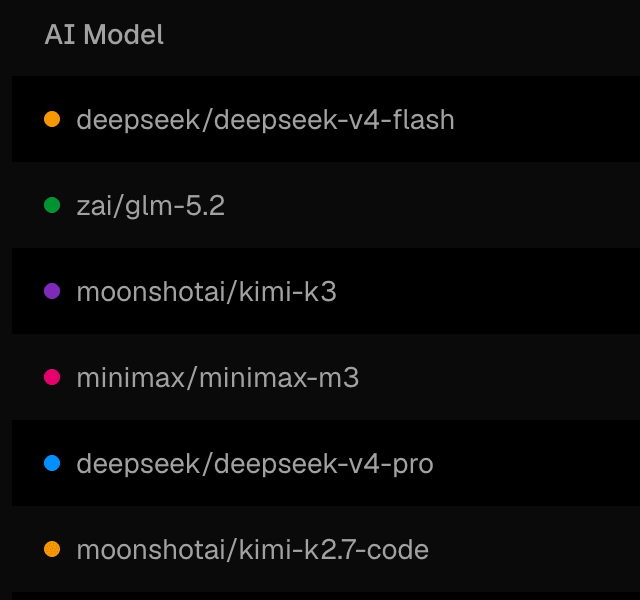
So we started digging into how Cline performs on open-weight models. Most Cline users are spoiled SOTA token-maxxers who burn billions of tokens on the latest frontier models. But all of us are experimenting more with open-weight models, learning how to work with them and how to improve them.
Our new SDK lets us measure the average token size of Cline requests, and the conclusion was damning: our requests ran 20–30% heavier than the publicly advertised averages of the most efficient harnesses. While we did have SOTA eval scores on most open-weight models, the extra token costs didn’t make that acceptable.
Promise of this blog
I have read dozens of eval blogs and learned that they are mostly about self-congratulation and benchmark-maxxing. This will be a different blog. I will walk you through the Hill Climber’s Checklist: five heuristics for hill climbing and how to approach them depending on your goals. In the end, I will leave you with over a thousand dollars worth of hill-climbing scores and traces. You can download and explore those traces to find nuanced findings by letting your agents go through them.
How do we run evals?
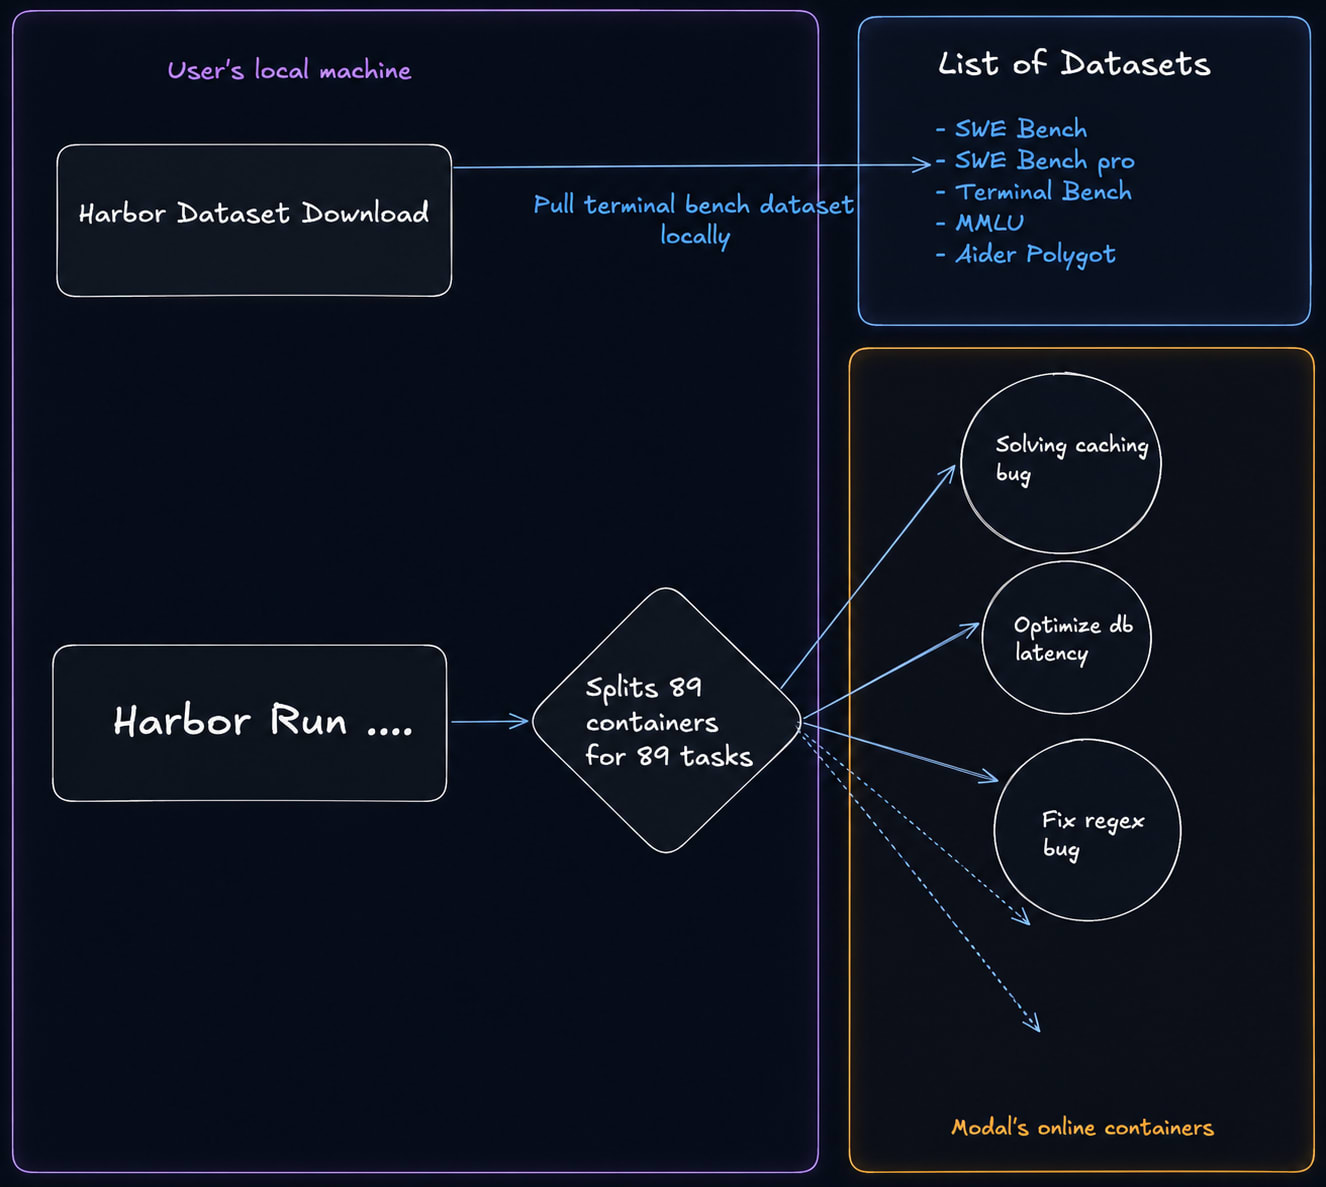
We use Harbor. It is a widely adopted agent-evaluation framework built by the creators of Terminal-Bench. It abstracts away sandbox management, the agent loop, and rollout monitoring to run evals.
Harbor lets you run tons of parallelized evals using Modal on the same 89-problem coding dataset, Terminal Bench, so you can do long eval runs across different coding agent harnesses and quickly figure out aggregate eval run metrics like input tokens, cached tokens, output tokens, net price, tool calls used, etc.
What do we optimize for evals?
When doing eval runs, you must think of them as multi-objective optimization problems in which you are balancing different, conflicting axes. The goal is to figure out the right mix of targets to optimize for.
Here are a few examples of conflicting targets:
- Cost vs Intelligence
- Thinking level vs Token Efficiency
- Time to Solve vs Eval score
- Token efficiency vs Eval score
All the above are scenarios in which you would like to optimize both parts of a conflicting goal, but you must pick the right balance. I can easily score 91% on Terminal Bench if I use Fable’s max mode, but it will cost 10 times as much as Kimi K3. So, is an extra 3% really worth 10 times the net run cost?
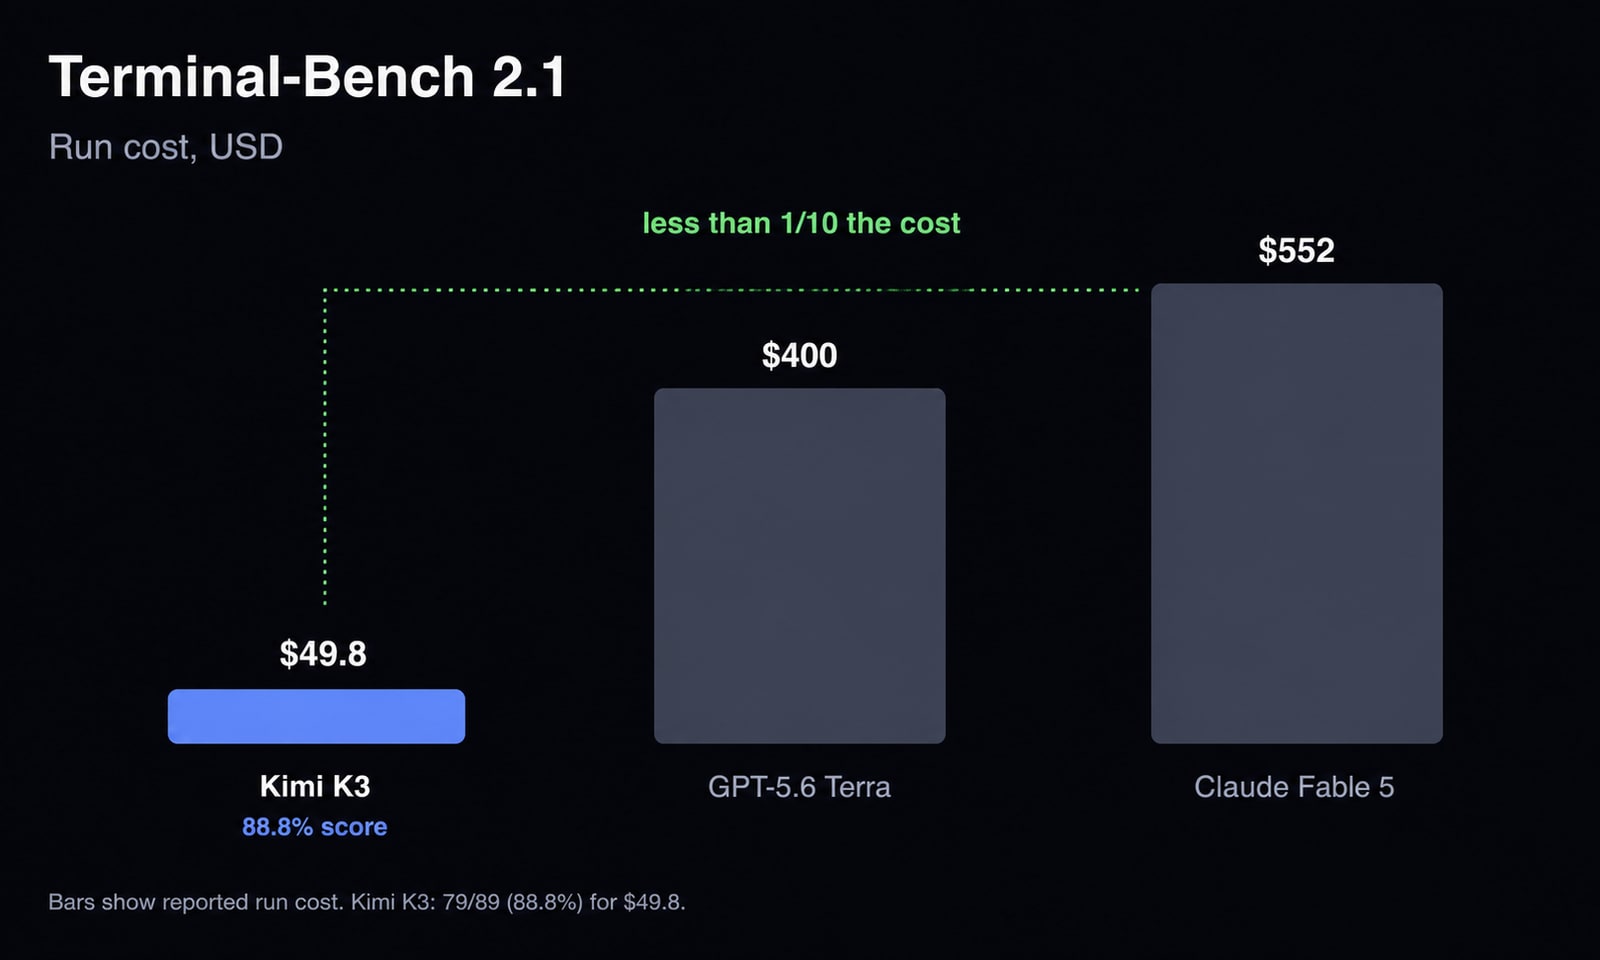
Most eval optimizations involve this type of conflict, in which you can pick your battles. Sometimes you are improving one thing at the expense of another, and you must diligently choose what works best for your use case. For us at Cline, SOTA performance is always a very high priority, but right after that, we care about giving our users the best value for money so they can solve the maximum number of problems with the minimum amount of money. We do things like caching and token-management optimizations, as well as bulk deals like Cline Pass, where we offer you bundled inference at a cheap cost.
Now for the heuristics. There are five, and together they make up the Hill Climber’s Checklist.
Get a North Star metric
A North Star metric protects you from two main failure modes of hill climbing:
- Doing too much: There’s only so much you can squeeze out of a model, and beyond that point you are just running in circles.
- Doing too little: You left improvement on the table because your harness was limiting the model.
The purpose of a North Star metric is to find the sweet spot: a score that’s reasonably high without spending too much time and effort on over-optimization. Most models perform best in their own harness because the model and the harness are intertwined through both tool-call usage and post-training optimizations.
Cline is building a common harness for everyone, and if you are reading this, you are probably building an agent that works with any model. So when a new model’s eval score comes in far below the number in its system card, we need to optimize. If it’s off by 1–3%, it’s usually not worth chasing a better score. But if it’s far below SOTA, you know it’s time to get to work. We generally aim to score as high as the best publicly available harness for that model.
Quantify the noise
One measure of a good eval is variance. For meaningful problems, the same model, harness, and configuration should show some variance in the number of eval tests passed. Hard, well-posed tasks put models near the pass/fail boundary, so identical reruns show a real score spread. That spread is what makes the eval discriminative and what gives GRPO-style RL a training signal. But you must first rule out flakiness as the source, which is why we often rerun the eval and report the distribution.
Here are a few examples of variance on Cline’s end
| Model | Setup | Spread |
|---|---|---|
| minimax-m3 | Same build, 5 reruns | 43.8% to 56.2% (±11 tasks); two back-to-back runs flipped 11 tasks up and 18 down |
| deepseek-v4-pro | Same build, 2 runs | 44.9% vs 53.9% (22 tasks flipped, some positive and some negative) |
| glm-5.1 | Same build, 3 reruns | 46.1% / 47.2% / 49.4% (24% of tasks flipped) |
| deepseek-v4-flash | Same build, 3 reruns | 38.2% / 44.9% / 48.3% (±5 tasks, error count went 20/17/9) |
| glm-5.2 | Same build, many reruns | 56.2% to 74.2% (~16 tasks) |
Note that the cause of variance must be identified. If there’s infrastructure flakiness on your end, that’s a problem you must solve. It could be anything from using a low-performance provider to flaky VMs. You must do everything possible to iron out variance in the eval runs and be confident that identical configuration values are respected.
Break down the failure mode
When the net eval score looks wrong, you must slice and dice it until you find where the problem lies. In Terminal-Bench, which has 89 tasks, you can often narrow down potential improvements by breaking down the problem in certain ways.
There are three ways to break it down, in order of priority: task, model, and provider.
Task
The best first method for breaking down failure patterns is by task. We had a token-bloat problem where some models were using a ridiculous number of tokens, and the first instinct was to treat it like a global problem where Cline uses too many tokens, so we need to fix token usage everywhere. In hindsight, that was the wrong frame.
When we compared our traces with those of agents that did not have the same bloat, the gap was not spread evenly across the benchmark. It was confined to a small set of tasks. In one run, about 250K tokens came from just 15 of 89 tasks, and the net token total was 450 million tokens, so roughly 55% of the tokens came from just 17% of the tasks.
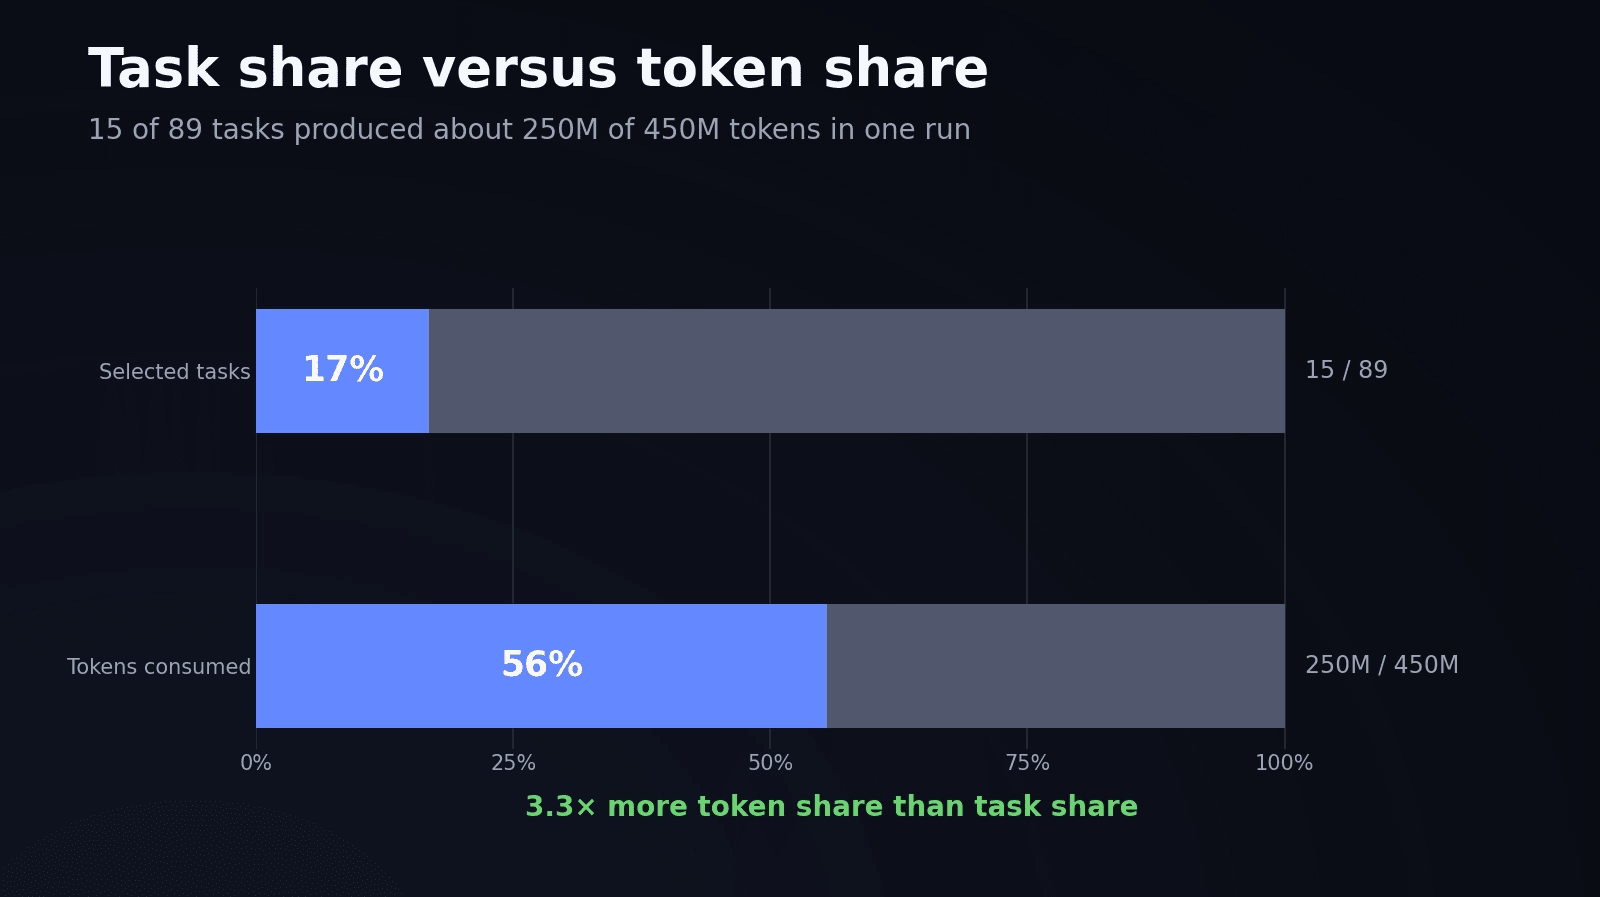
It’s often very hard to figure out what is wrong with only a certain set of tasks and not others. Aside from looking at tokens, you can also specifically examine their failures.
Instead of manually looking at them, you can ask your agentic harness to go through the traces with different subagents and then give you a summary. I think that is much better than looking at traces with your own eyes.
So, instead of trying to fix token bloat across all 89 tasks, we could isolate those tasks, inspect what the agent was doing differently, and then, once the fixes were made, do a final sanity check across all tasks.
So the way to go about this is:
- Begin by identifying problematic tasks.
- Selectively improve and rerun your fixes on the selected tasks.
- Once improvement is confirmed, do a full-scale run as a sanity check to make sure the fix doesn’t break other tasks.
Model
If you are building a common harness, you are not going to maintain a completely different code path and system-prompt flow for every model. Most of the harness is shared: compaction logic, tool calls, context handling, computer use, and subagents usually work using similar logic. The tradeoff that comes with a common harness is that improvements for one model can make other models worse.
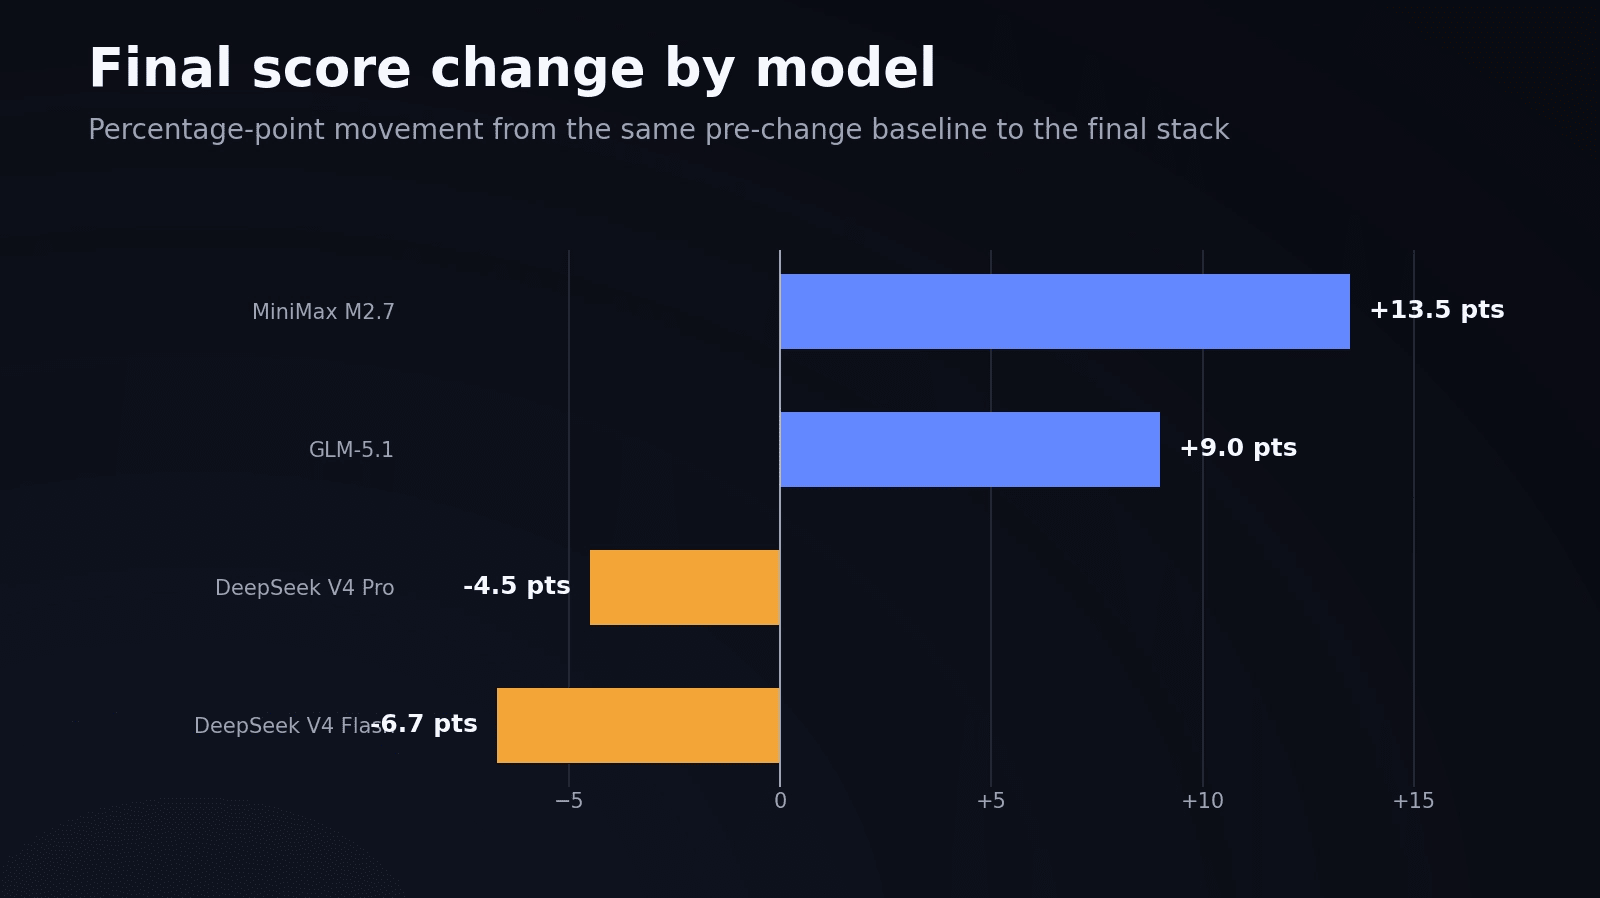
A classic example was an experiment in which we added tool-bloat truncation to solve token bloat in MiniMax models.
| Model | Before → with the fix → final stack | Direction |
|---|---|---|
| minimax-m2.7 | 32.6% → 41.6% → 46.1% | +13.5 points ▲ |
| glm-5.1 | 48.3% → 52.8% → 57.3% | +9.0 points ▲ |
| deepseek-v4-pro | 47.2% → 47.2% → 42.7% | −4.5 points ▼ |
| deepseek-v4-flash | 48.3% → 43.8% → 41.6% | −6.7 points ▼ |
With one truncation clamp, we saw that it improved MiniMax M2.7 by 13.5 points and GLM-5.1 by 9 points. But it also hurt DeepSeek Flash by 6.7 points and DeepSeek Pro by 4.5. So the same change had opposite effects on different models.
The cut itself was simple: any tool output over 50K got clamped to 8K by keeping the head and tail and deleting the middle. That was pure deletion without compression, so nothing summarized what was removed. Rereading the same file returned the same truncated view, so the model had no way to recover the missing middle. It still helped because an agent resends its entire history on every turn. One giant observation gets paid for on every future request, so trimming it kept the conversation shape sane, preserved cache locality, and cut the cost.
Whether it helps a specific model depends on how that model reads long context. GLM and MiniMax get lost in the middle of long noisy output, so deleting the middle sharpened them: +13.5 and +9 points. DeepSeek reasons over the body and tail of long tool outputs, so the deleted middle held state it was still using, and with no way to get it back it dropped 6.7 and 4.5 points. So it turns out that the same knob had opposite effects depending on the model.
To fix this, you have two options:
A. Make changes comprehensive enough to work generically for most models.
B. Use completely different algorithmic routes for different models. This comes with the drawback of having to maintain mappings between models and mechanisms indefinitely.
We have pursued option B in many ways, using prompt families for different models to optimize for the best parts of different model families, but only after a carefully considered refactor.
In your case, you are looking for the tradeoff. Which models got better? Which ones got worse? And is the regression acceptable for the use case you actually care about? There is no universally better harness. There is only what is better for a particular model, provider, and use case, and you must find that out for yourself.
Providers
Believe it or not, the same model is not the same model on every provider. Many frontier open-weight models are served by multiple providers, such as CoreWeave, Baseten, and Fireworks. People assume the difference between providers is just quantization, but that is only a small part of the story.
Different providers differ in cache hit ratios, quantization, TTFT, latency, and pricing, and every one of those moves your eval metrics. Whenever we onboard a new provider to route traffic to, we make sure its eval score is on par with the others. You can have a good eval score and a bad cache hit rate at the same time. If you don’t run evals, you won’t know what went wrong.
Here is one concrete example from our GLM-5.2 runs using the same build on two providers:
- CoreWeave at medium reasoning: 66/89 tasks, 74.2%.
- OpenRouter general routing at medium reasoning: 55/89 tasks, 61.8%.
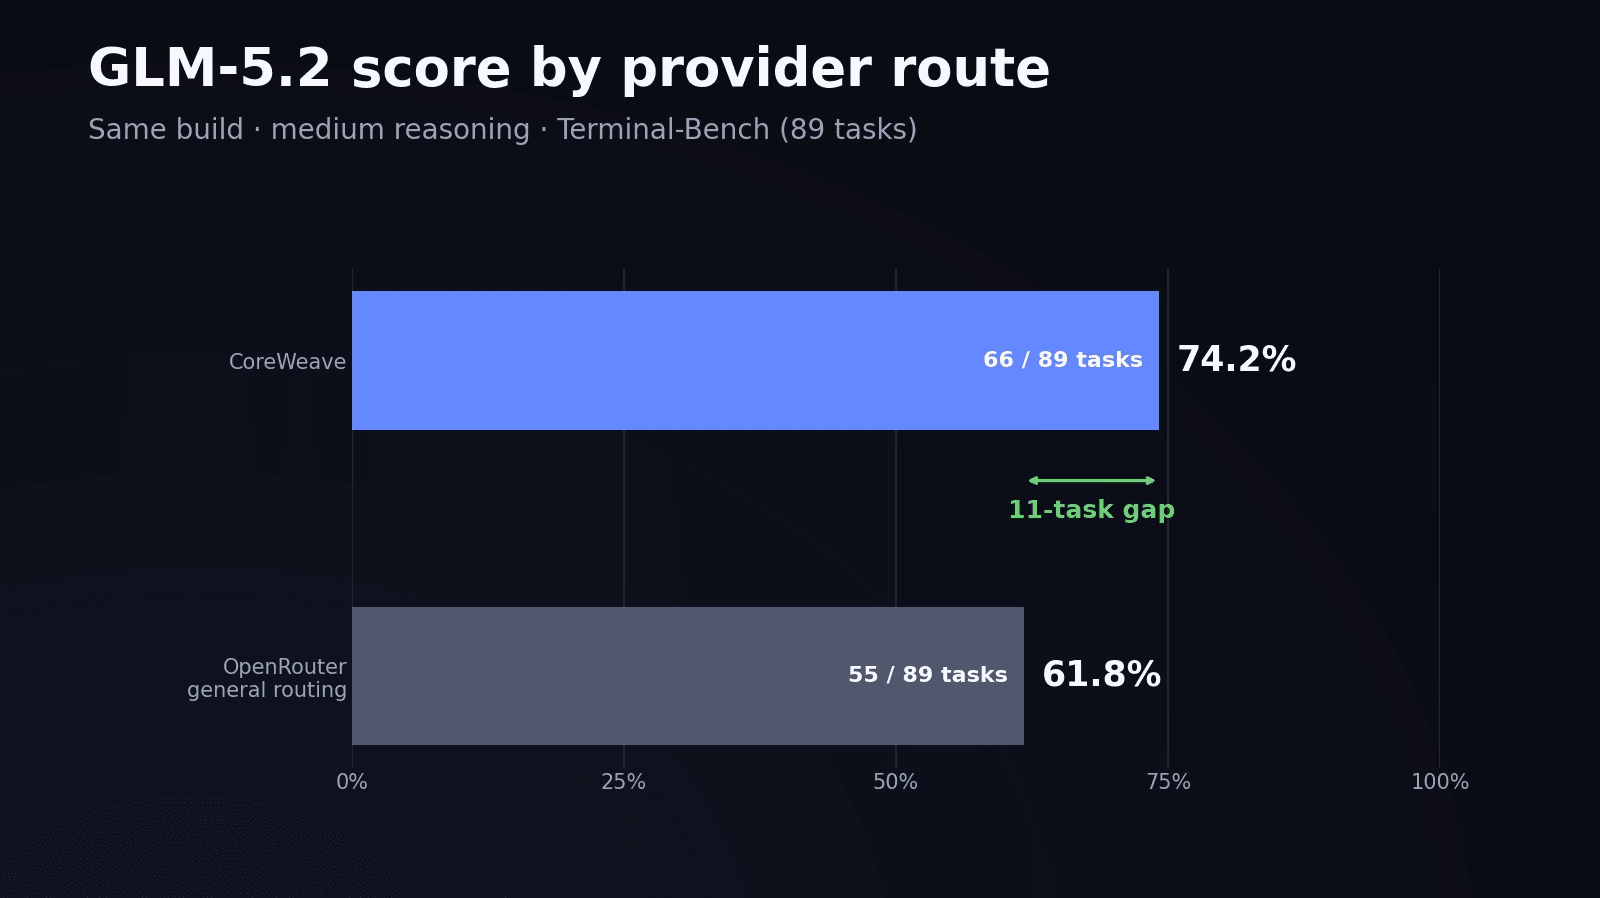
The route alone was worth 11 tasks, so we learned to track each provider route as its own entry. We have also observed up to a 2x difference in net tokens and cache hit rates between providers, which can turn a $20 run into a $43 run for the same eval.
The moral of the story is that you must be careful when dealing with different open-weight providers and test them with evals before shifting traffic.
More thinking is not automatically better
When it comes to thinking, the general belief is that more is better. This is not necessarily true. Reasoning effort is not a free intelligence knob. It costs more, and sometimes it lowers the score.
Opus 5’s FrontierCode result is a classic counterexample to the idea that more thinking leads to better results.
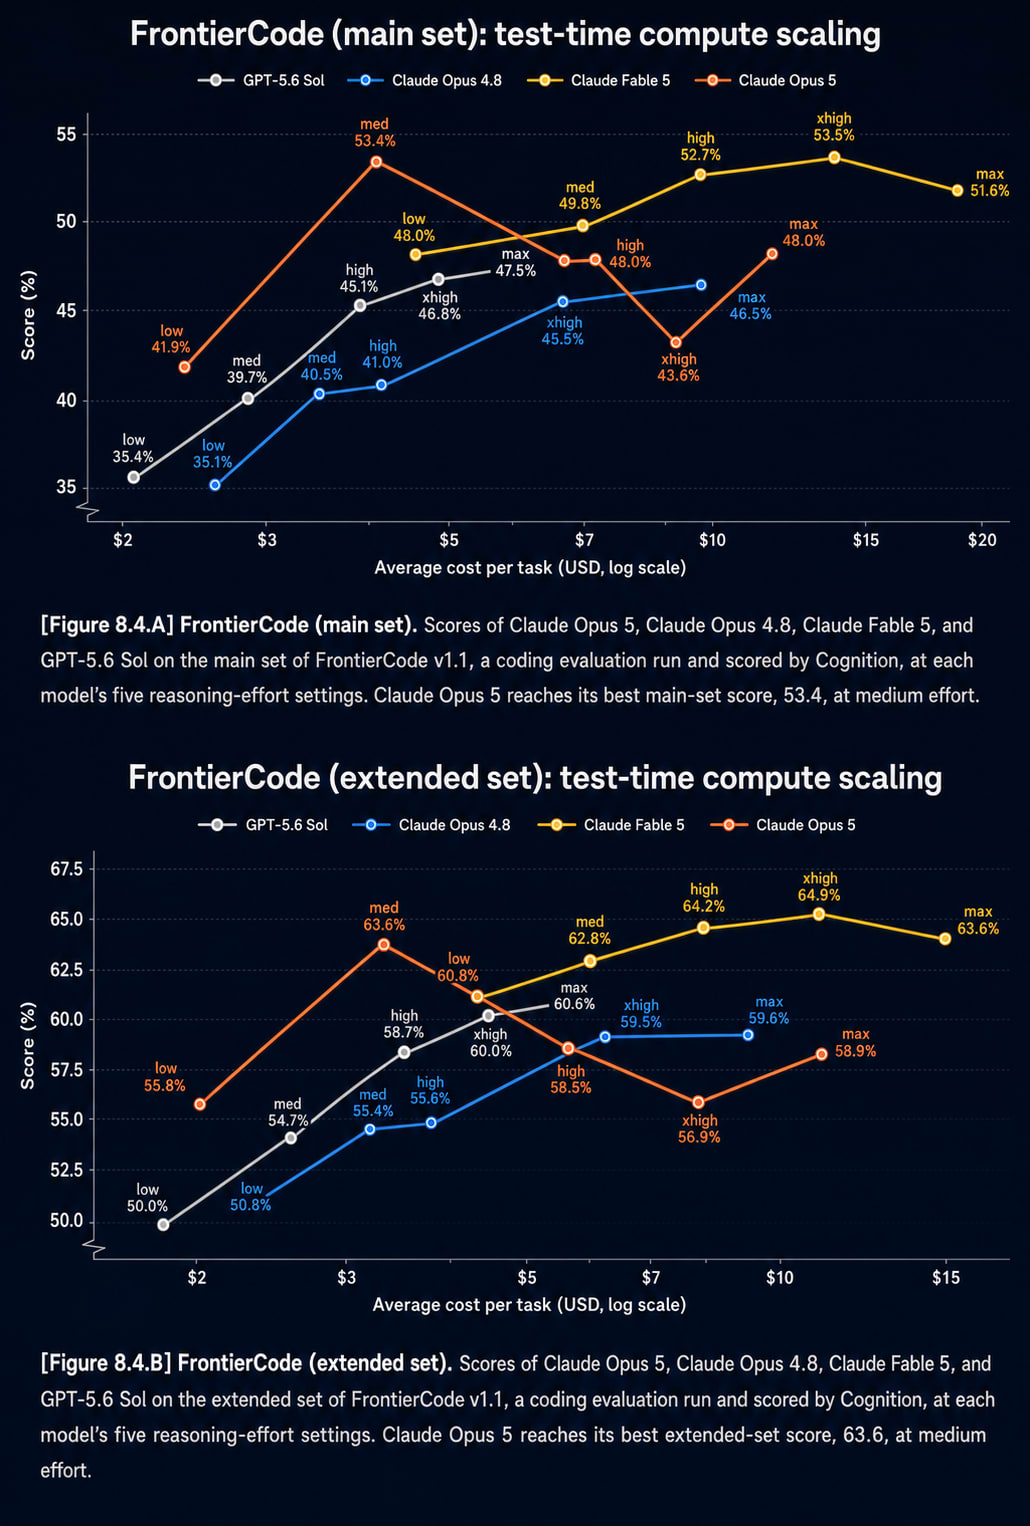
You can see that medium thinking outperformed high, extra-high, and maximum on the main split.
This means you have to run the matrix. The model, provider, harness, and task distribution decide where the useful reasoning budget is. More thinking can be more expensive and less effective, and sometimes the extra score gains from more thinking don’t justify the increase in price because thinking tokens are very expensive output tokens.
Keep a private set
Tons of companies are making their own evals, and you should make them too if you can. Many eval methods suffer from reward-hacking behaviors in which models simply look up the answers on the internet; alternatively, eval sets “accidentally” enter the training set.
Having a private set of worthwhile problems with good verifiers is the best way to test models. If you would like to make a good benchmark yourself, this is an incredible blog post from the Terminal-Bench team.
Parting Note
There’s no better applied AI exercise than working through evals. It will help you understand why your agents are going wrong and how to squeeze the best possible performance out of a model and expose you to the tradeoffs that align with your teams goals.
Evals are ultimately a trial-and-error mechanism. Unless you try, iterate, and make plenty of mistakes, you’ll never really learn how to do it well. As promised, I am attaching dozens of eval run traces so that you can see how Cline’s runs on different models, you are welcome to run agents on these runs to see the failure modes and learn from that.
Evals are hard and these heuristics are a great place to start. If you do it enough, you might even be able to write recursive self-improving prompts to automate yourself out of the eval improvement loop altogether.