Open-sourcing my health
Watch on YouTube · Download the MP4
For eight years my health data sat in separate places: a 23andMe genotype file, an Apple Watch export, a DEXA report, and blood test PDFs from four labs. I had never looked at most of it.
So I put it all in one folder, parsed it on my laptop and drew three pictures from it. Each one is an interactive page. Hover anything to read the number underneath.
The three pages
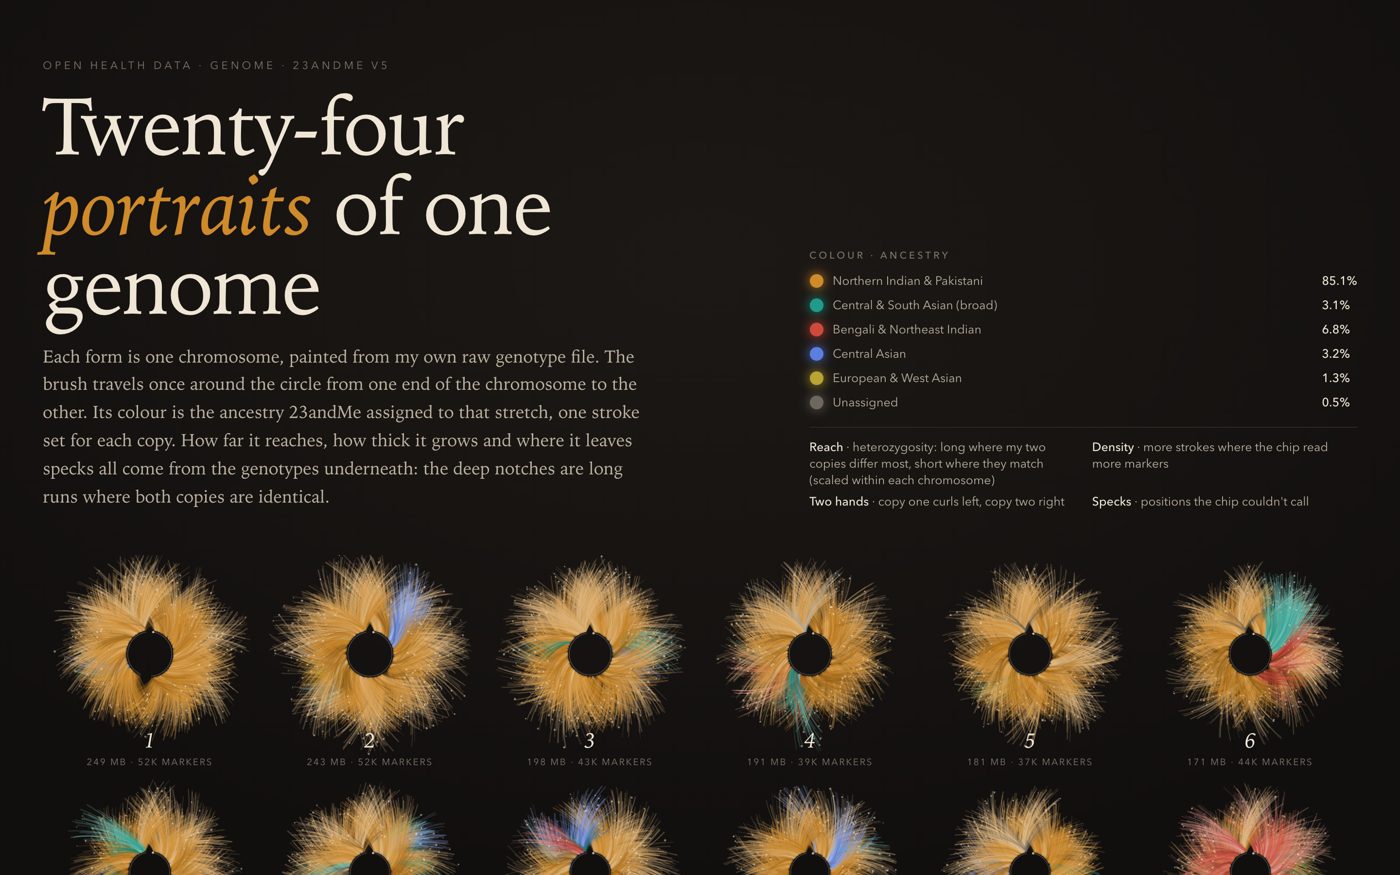
Twenty-four portraits of one genome
Each chromosome is one brush stroke around a circle, coloured by the ancestry 23andMe assigned to that stretch. Its reach and thickness come from about 630,000 markers on the v5 chip, binned into 2-megabase windows.
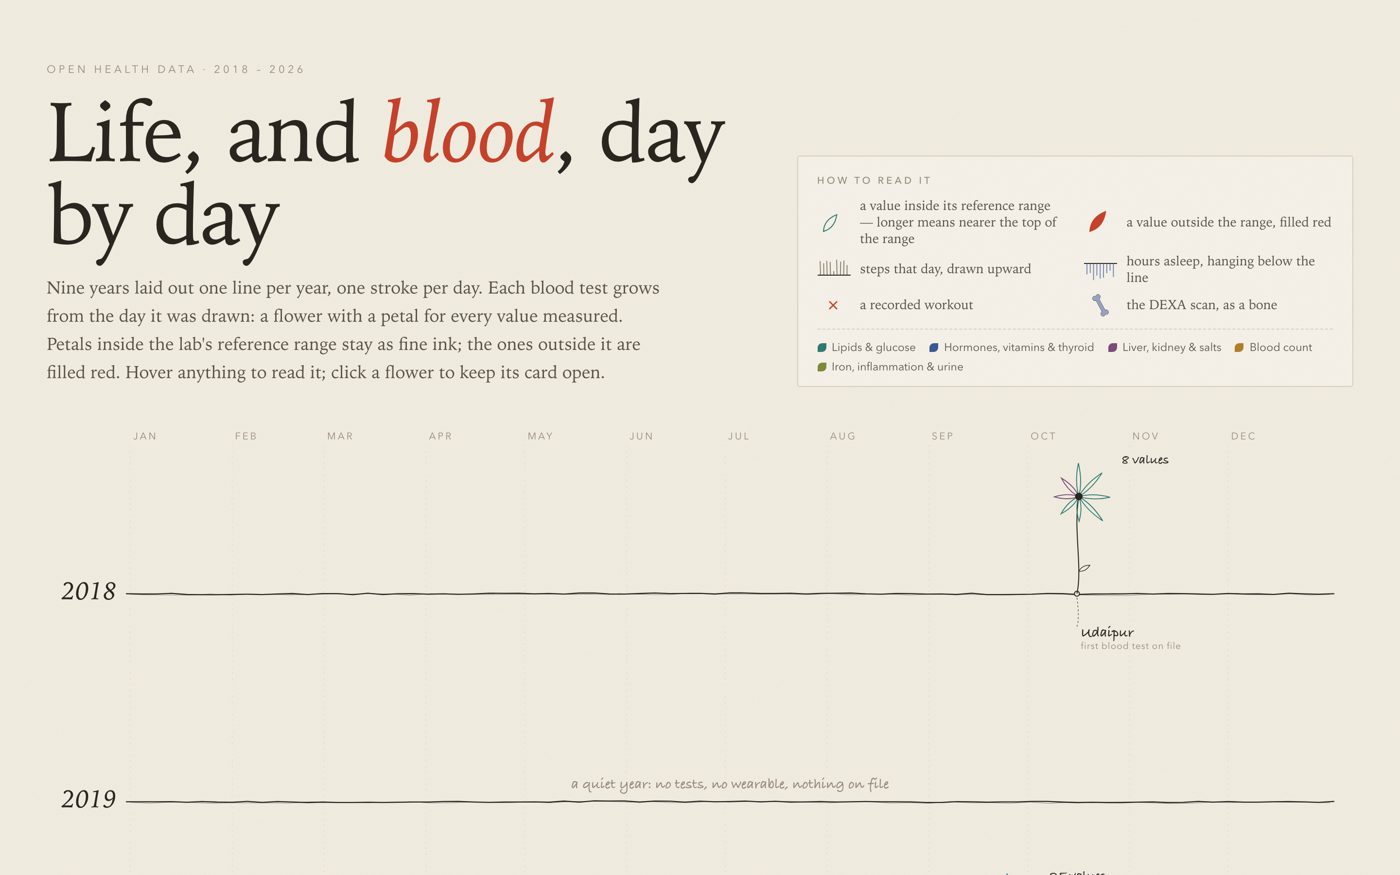
Life, and blood, day by day
One line per year, one stroke per day. Each blood test grows as a flower with a petal for every value; red petals mark values outside the lab's range. 211 values from six panels, with steps, sleep and workouts along the line.
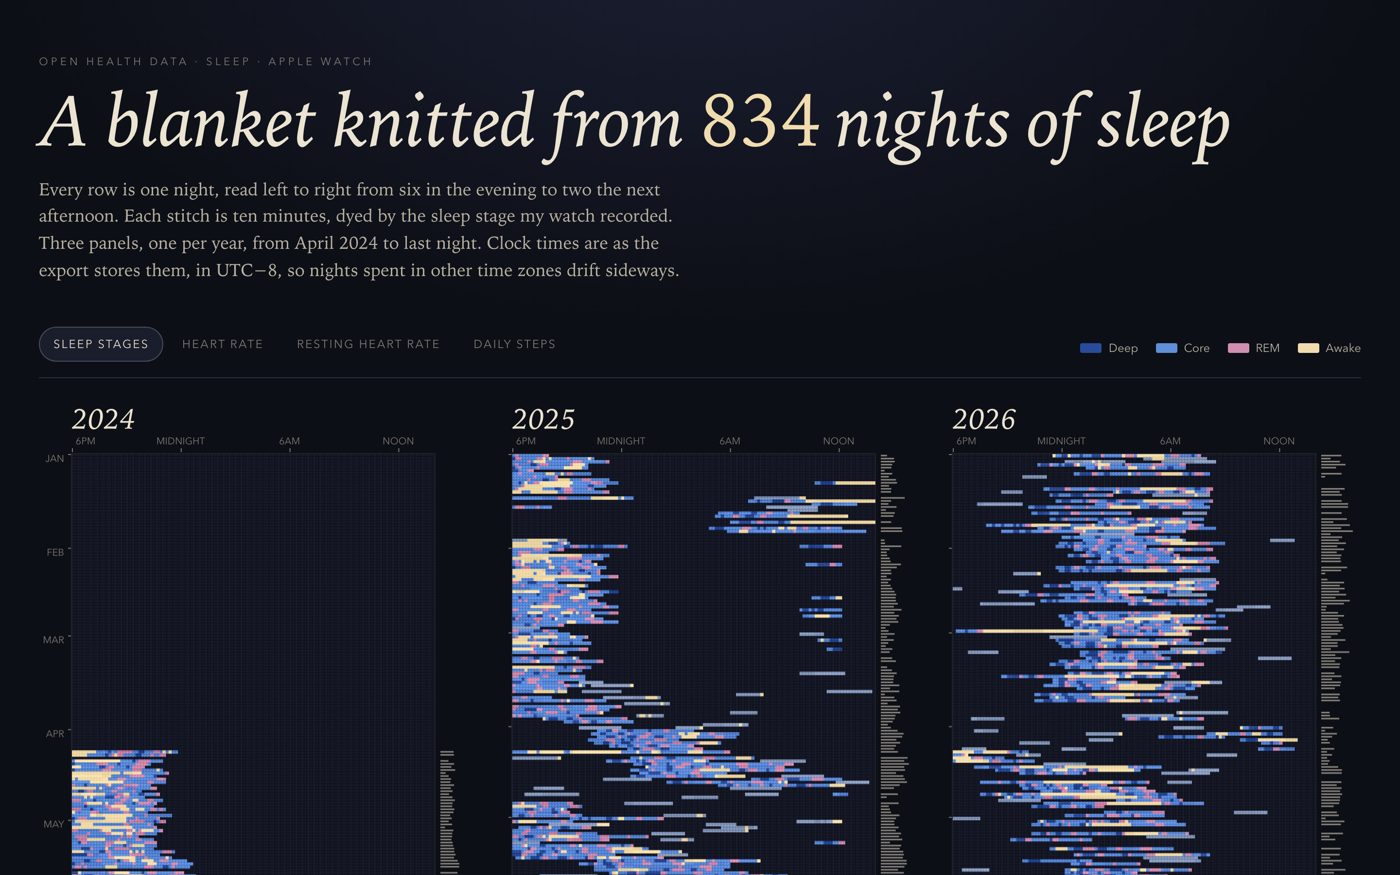
A blanket knitted from 834 nights of sleep
One row per night, one stitch per ten minutes, dyed by the sleep stage my watch recorded. Switch the weave to heart rate, resting heart rate or daily steps.